Skin dose maps
Functionality that is available
Skin dose map data is calculated to the surface of a simple geometric phantom using the in-built openSkin routines (3D phantom)
The calculated doses include kVp-dependent backscatter factors and account for any copper filters using data from this paper for each irradiation event; aluminium or other filters are not considered. Where more than one kVp is stored for an irradiation event the mean kVp is calculated, excluding any zero values.
The phantom dimensions are calculated from the height and mass of the patient; defaults of 1.786 m and 73.2 kg are used when patient height and mass are not available
Data can be calculated on import to OpenREM, or on demand when a study is viewed. Calculating the skin dose map can take several minutes.
Data is recalculated automatically if the patient height or mass stored in the database differs from the values stored in the skin dose map data file. This is useful when patient size information has been imported in to OpenREM after the initial skin dose map data has been calculated
3D skin dose map data is shown graphically as a 2D image and a 3D model
The 3D model can be manipulated using a touch screen
The user can change the maximum and minimum displayed dose; alternatively, window level and width can be adjusted
A colour dose scale is shown with a selection of colour schemes
The skin dose map section can be displayed full-screen
The calculated peak skin dose, phantom dimensions, patient height, mass and orientation used for the calculations are shown in the top left hand corner of the skin dose map
Additionally the percentage of exposures that interact with the phantom and therefore contribute to the skin dose is shown as DAP percentage contributed, enhancing the interpretability of the skin dose calculation.
If skin dose map display is disabled then fluoroscopy study data can be exported in a format suitable for the stand-alone openSkin routines
The phantom consists of a cuboid with one semi-cylinder on each side (see 3D phantom section of phantom design on the openSkin website for details).
2D visualisation of the 3D data
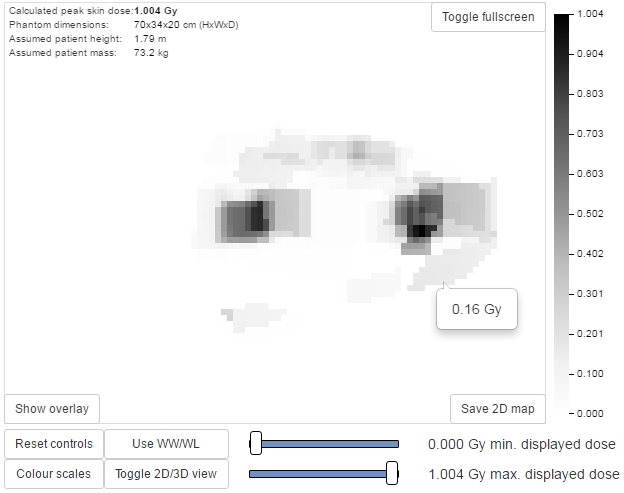
Figure 1: 2D visualisation of the 3D data
This is a 2D view of the whole surface of the 3D phantom, as though the phantom surface has been peeled off and laid out flat (figure 1). The 2D visualisation includes the following features:
The skin dose at the mouse pointer is shown as a tool-tip
Moving the mouse whilst holding down the left-hand mouse button changes the window level and width of the displayed skin dose map
An overlay indicating the phantom regions and orientation can be toggled on and off. This indicates the phantom anterior, left, posterior and right sides, and also shows the superior and inferior ends (figure 2)
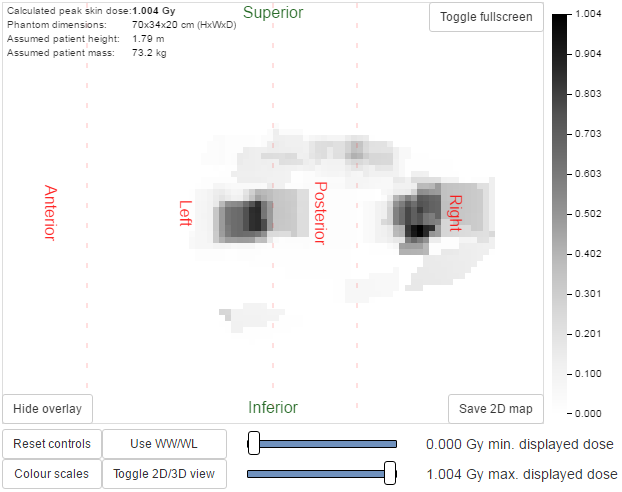
Figure 2: Phantom region overlay
The current view can be saved as a png file
3D visualisation
This is a 3D view of the phantom that was used for the calculations, with the skin dose map overlaid onto the surface. The 3D visualisation includes the following features:
Moving the mouse whilst holding down the left-hand mouse button rotates the 3D model
Using the mouse wheel zooms in and out
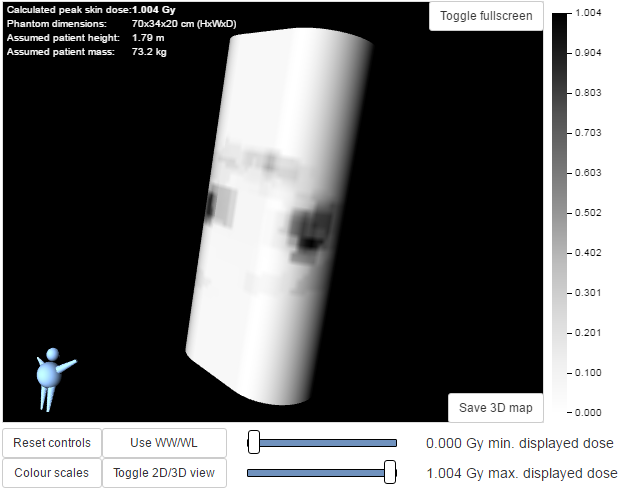
Figure 3: 3D visualisation of the data
A simple 3D model of a person is displayed in the bottom left corner. This is to enable the viewer to orientate themselves when viewing the 3D skin dose map
The current view can be saved as a png file
Skin dose map settings
There are two skin dose map options that can be set by an OpenREM
administrator via the Skin dose map settings option in the Config menu:
Enable skin dose maps
Calculate skin dose maps on import
Ignore systems safelist
The first of these sets whether skin dose map data is calculated, and also switches the display of skin dose maps on or off. The second option controls whether the skin dose map data is calculated at the point when a new study is imported into OpenREM, or calculated when a user first views the details of that particular study in the OpenREM interface. The third option allows the user to enables skin dose maps for systems that are not validated for OpenSkin.
When skin dose maps are enabled:
When a user views the details of a fluoroscopy study OpenREM looks for a skin dose map pickle file on the OpenREM server in the
skin_mapssubfolder ofMEDIA_ROOTthat corresponds to the study being viewed. If found, the skin dose map data in the pickle file is loaded and displayed. Theskin_mapsfolder is created if it does not existIf a pickle file is not found then OpenREM calculates skin dose map data. These calculations can take some time. They are carried out in the background: an animated graphic is shown during the calculations. On successful calculation of the data the skin dose map is displayed. A pickle file containing the data is saved in the server’s
skin_mapssubfolder ofMEDIA_ROOT. The file name is of the formskin_map_XXXX.p, whereXXXXis the database primary key of the studyFor subsequent views of the same study the data in the pickle file is loaded, rather than re-calculating the data, making the display of the skin dose map much quicker
When calculation on import is enabled:
OpenREM calculates the skin dose map data for a fluoroscopy study as soon as it arrives in the system
A pickle file containing the data is saved in the
skin_mapssubfolder ofMEDIA_ROOTUsers viewing the details of a study won’t have to wait for the skin dose map data to be calculated
Exporting data to openSkin
If skin dose maps are disabled, and the user has export rights, the user is presented with the option of exporting the study data as a csv file that is formatted for use with a stand-alone installation of openSkin. The user must be in the detail view of the study they wish to create the exposure incidence map for, and then click on the link to create the OpenSkin export (figure 4).
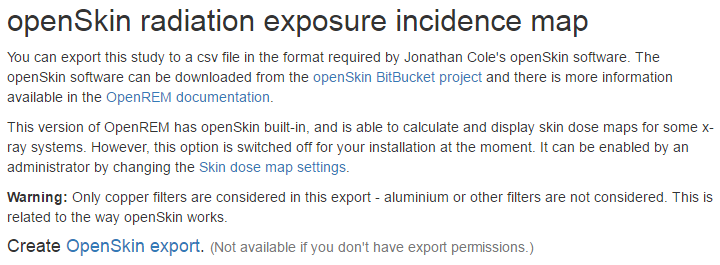
Figure 4: Export from OpenREM to openSkin
Instructions for openSkin
Download the openSkin repository as a zip file from openSkin downloads. To use openSkin as a stand-alone application you need python 2.x and the pypng python library.
Extract the contents of the zip file into a folder on your computer and run python main.py from a command line and answer each question.
See phantom design for details of the 2D and 3D phantoms.
When asked for the source csv file use the one exported from OpenREM
Depending on the number of events in the export and the power of your computer the calculations can take a few minutes
Two files will be produced - a textfile called skin_dose_results.txt and a
small image called skin_dose_map.png
Results text file
It should look something like this:
File created    : 04/21/15 17:42:45
Data file       : C:/Users/[...]/exports-2015-04-21-OpenSkinExport20150421-162805246134.csv
Phantom         : 90.0x70.0 3d phantom
Peak dose (Gy)  :                  0.50844405521
Cells > 3 Gy    :                              0
Cells > 5 Gy    :                              0
Cells > 10 Gy   :                              0
The peak dose is the peak incident dose delivered to any one-cm-square area. If any of these 1 cm2 areas (referred to as cells) are above 3 Gy, then the number of cells in this category, or the two higher dose categories, are listed in the table accordingly.
Incidence map image file
The image file will be a small 70x90 px PNG image if you used the 3D phantom, or 150 x 50 px PNG if you used the 2D phantom. With both, the head end of the table is on the left.
The image is scaled so that black is 0 Gy and white is 10 Gy. For most studies, this results in an incidence map that is largely black. However, if you use GIMP or ImageJ or similar to increase the contrast, you will find that the required map is there.
A native and ‘colour equalised’ version of the same export are shown below:


Limitations
Skin dose map calculations do not currently work for all systems. Siemens Artis Zee data is known to work. If skin dose maps do not work for your systems then please let us know via the OpenREM Google Group.
Monte Carlo validation has been carried out for a Siemens Artis zee system for the body section of the phantom: openSkin results were within ± 20% of the Monte Carlo results (Platten 2023). Skin dose values depend on the accuracy of the x-ray system’s dose at reference point and DAP values. For other types of x-ray system the results are for indication only as they have not been validated.
If you would like to help with validation of openSkin please do go ahead and feed back your findings to Jonathan Cole at jacole and David Platten at dplatten.
References
Platten, D. “Monte Carlo simulation of skin dose distribution from interventional cardiology procedures”, Doctor of Clinical Science thesis (2023), The University of Manchester, UK (external link to thesis).